Is the diversification ratio time-varying?
Evidence for Brazilian Market
Today we are going to check whether the diversification index proposed by Choueifaty and Coignard (2008) varies over time and some characteristics of this index.
The construction of this analysis will be done using python.
The Bovespa Index is the main stock index in the Brazilian market and is composed of around 90 stocks. You can check the daily composition of the index here.
Remember the repository for this analysis can be found here.
The first thing we do is import the packages that will be used here. Stock data are obtained through the investpy package, but it is made from the function built by me called get_stock_dataframe.
import pandas as pd
import numpy as np
from investpy import get_stock_historical_data, get_index_historical_data, get_stocks_list
from get_stocks_df import get_stock_dataframe
the function get_index_historical_data is needed to get the data from the ibovespa index. And the get_stocks_list function is for us to know which shares of B3 can be downloaded by investpy.
data_stocks =  {'start_date': '01/01/2019',
				'country': ' brazil',
				'final_date':'21/10/2021' }


tickers_investpy = get_stocks_list(data_stocks.get('country'))

all_tickers = theorical_portfolio['Código'].tolist()
Below, we check the Bovespa tickers that can be found at investpy.
tickers_stock_list = [item for item in all_tickers if item in tickers_investpy]

filtered_theorical_portfolio = theorical_portfolio[theorical_portfolio['Código'].isin(tickers_stock_list)]

amount_assets = np.array([ filtered_theorical_portfolio['Qtde. Teórica'].tolist()])
We get the total theorical amount for tickers in investpy sum them and get the individual weights in stocks.
total_theorical_amount =  amount_assets.sum()

weights_bovespa =  np.multiply(amount_assets,1/total_theorical_amount)
In the Ibovespa index portfolio we had 90 stocks, in investpy we have 80 stocks. Therefore, it is important to emphasize here that the analysis done here is an approximation.
stocks_bovespa = get_stock_dataframe(tickers_list = tickers_stock_list,**data_stocks)
The above call may take a long time. If you don’t know how we set up the get_stock_dataframe()function visit here.
array_stocks = np.array(stocks_bovespa)

get_arithmetic_returns = lambda prices_array:  np.diff(prices_array, axis =0 ) / prices_array[ : -1]

returns = get_arithmetic_returns(array_stocks)
We calculate linear returns using numpy library. Below we build three functions:
One to calculate the covariance, another for the index of diversification of the article and also one to calculate one to calculate the rolling of this index.
get_covariance = lambda returns_array: np.cov(returns_array.T)

diversification_index = lambda  volatilities,covariance,weights: np.dot(weights, volatilities.T)/ np.sqrt(np.dot(np.dot(weights,covariance.T),weights.T))

def rolling_diversification(returns_array,weights):
	days_rolling = 21
	diversification_rolling = [] ; index = []
	size_array = returns_array.shape[0]
	for i in range(days_rolling,size_array,days_rolling):
		covariance = get_covariance(returns_array[i-days_rolling:i])
		vol_stocks = np.array([np.diag(covariance)])

		div_index = diversification_index(vol_stocks,covariance,weights)
		index.append(i); diversification_rolling.append(div_index[0][0])

	return index, diversification_rolling
Above we used a rolling covariance matrix of 21 days.
Finally, below we call the functions created previously and verify the behavior of the rolling diversification index with the ibovespa index.
date_index_diversification,ratio_diversification = rolling_diversification(returns,weights_bovespa)

date_index = [stocks_bovespa.index.tolist()[i] for i in date_index_diversification]

ratio_df = pd.DataFrame({'Date':date_index, 'Ratio_diversification':ratio_diversification})
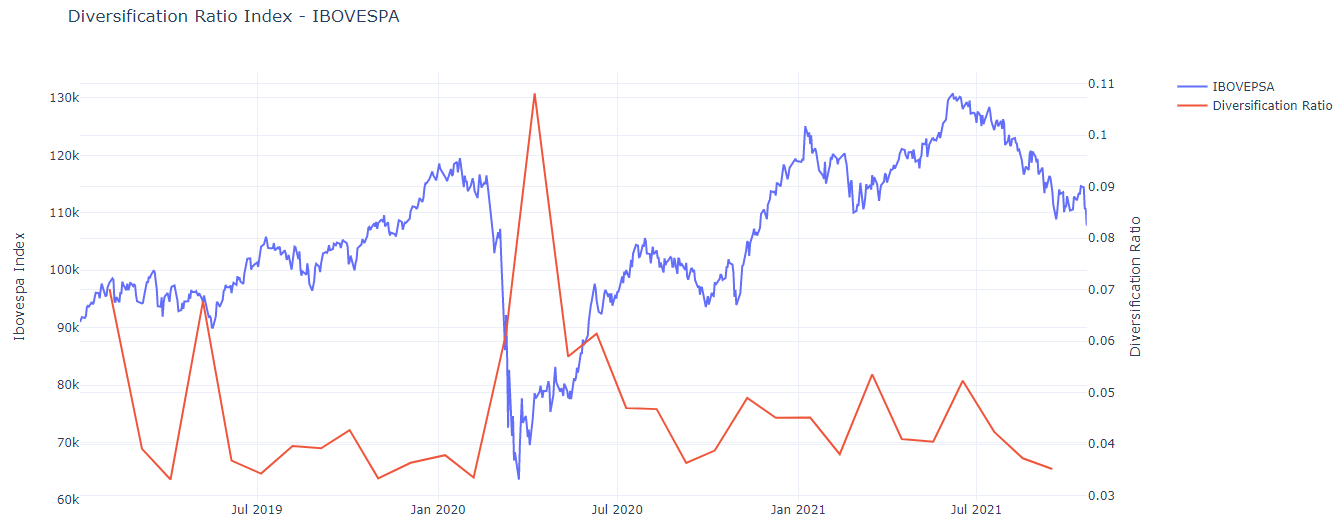
Note the inverse relationship between the diversification index and the Ibovespa.
In bear times are where the greatest opportunities for diversification are seen, note that at the end of March 2020 some stocks had very different behaviors and the covariances were noisy. Therefore, the diversification index expands strongly.