Realized Volatility in Bitcoin
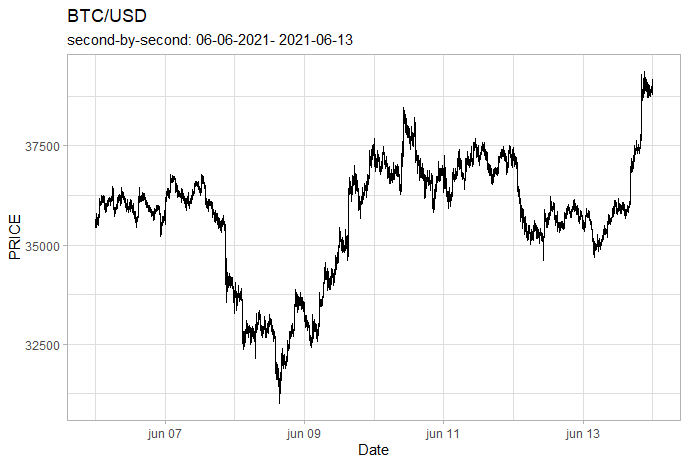
One of the most relevant characteristics of digital assets is the high volatility observed in their prices. In this context, it is necessary that we have an adequate estimate of this parameter. In addition, there is great value in models that seek to predict future asset volatility values, which can be seen in the extensive literature on this topic. Here we will manipulate a Bitcoin high frequency database, extracted from Binance to access the repository click here. Let’s calculate realized volatility and forecast it.
pacman::p_load(tidyverse,magrittr,dplyr,lubridate,zoo,xts,stringr,highfrequency)
sep = ','
df_trades <- read.csv2('data/dataset_trades.csv', sep = sep)
We will build from tick-by-tick to second-by-second data as follows
scale_microseconds = 1000000
df_trades%<>% as_tibble() %>% mutate(timestamp =as_datetime(as.POSIXct(df_trades$timestamp / scale_microseconds 								origin = "1970-01-01",tz = 'UTC')))
df_trades %<>% mutate(price = as.numeric(price),
                           amount = as.numeric(amount)) # Change some datatypes

df_trades %>% rename(SYMBOL = symbol,DT = timestamp,PRICE = price) %>%
  select(DT,PRICE, SYMBOL)%>% mutate(PRICE = as.numeric(PRICE))%>%
  data.table::data.table() -> df_BTC
The estimation of realized volatility is performed using the two times scale estimator (TTSE) by Zhang (2005). This estimator assumes a diffusion process for prices. Another point of TTSE is that microstructure noise is considered I.I.D..
TTSE_RV<-rAVGCov(rData = df_BTC[, list(DT, PRICE)], alignBy = "minutes",alignPeriod = 15,
                 makeReturns = TRUE)
returns_btc <- df_BTC[, makeReturns(PRICE), by = list(DATE = as.Date(DT))]

btc <- as.xts(returns_btc$V1, order.by = as.POSIXct(as.character(returns_btc$DATE)))
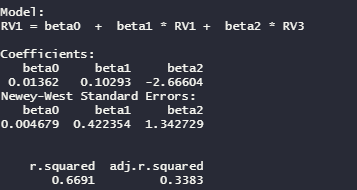
In addition to realized volatility, it is of interest to estimate future realized volatility, we do this through the heterogeneous autoregressive (HAR) model of Corsi (2009).
HAR_RV <- HARmodel(btc, periods = c(1,3),
                   RVest = c("rAVGCov"), type="HAR",
                   inputType = 'returns')
The HAR model is nothing more than an OLS that takes into account different periods according to how the information can be interpreted by each trader.
Below we can see the predicted and observed values:
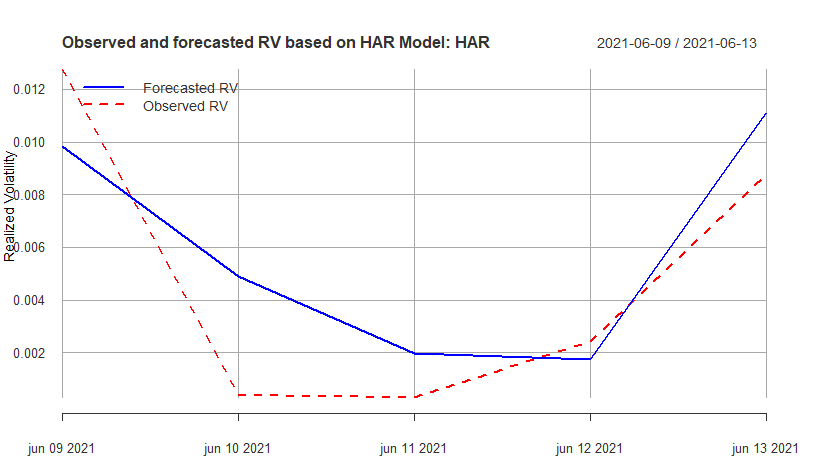
It is always worth mentioning here, although the realized volatility at t is dependent on past period volatility, the relationship between realized volatility and returns is not equally significant.